

Here’s the first edition of what will be semi-regular updates on Australian Markets (and occasionally NZ markets, if there is interest) — a key part of this will be highlighting content from the Australian Market Valuation Book, but also presenting useful timely updates intramonth.
This week we’re looking at Australian Commonwealth Government Bonds (ACGBs), with a focus on the 10-year part of the curve.
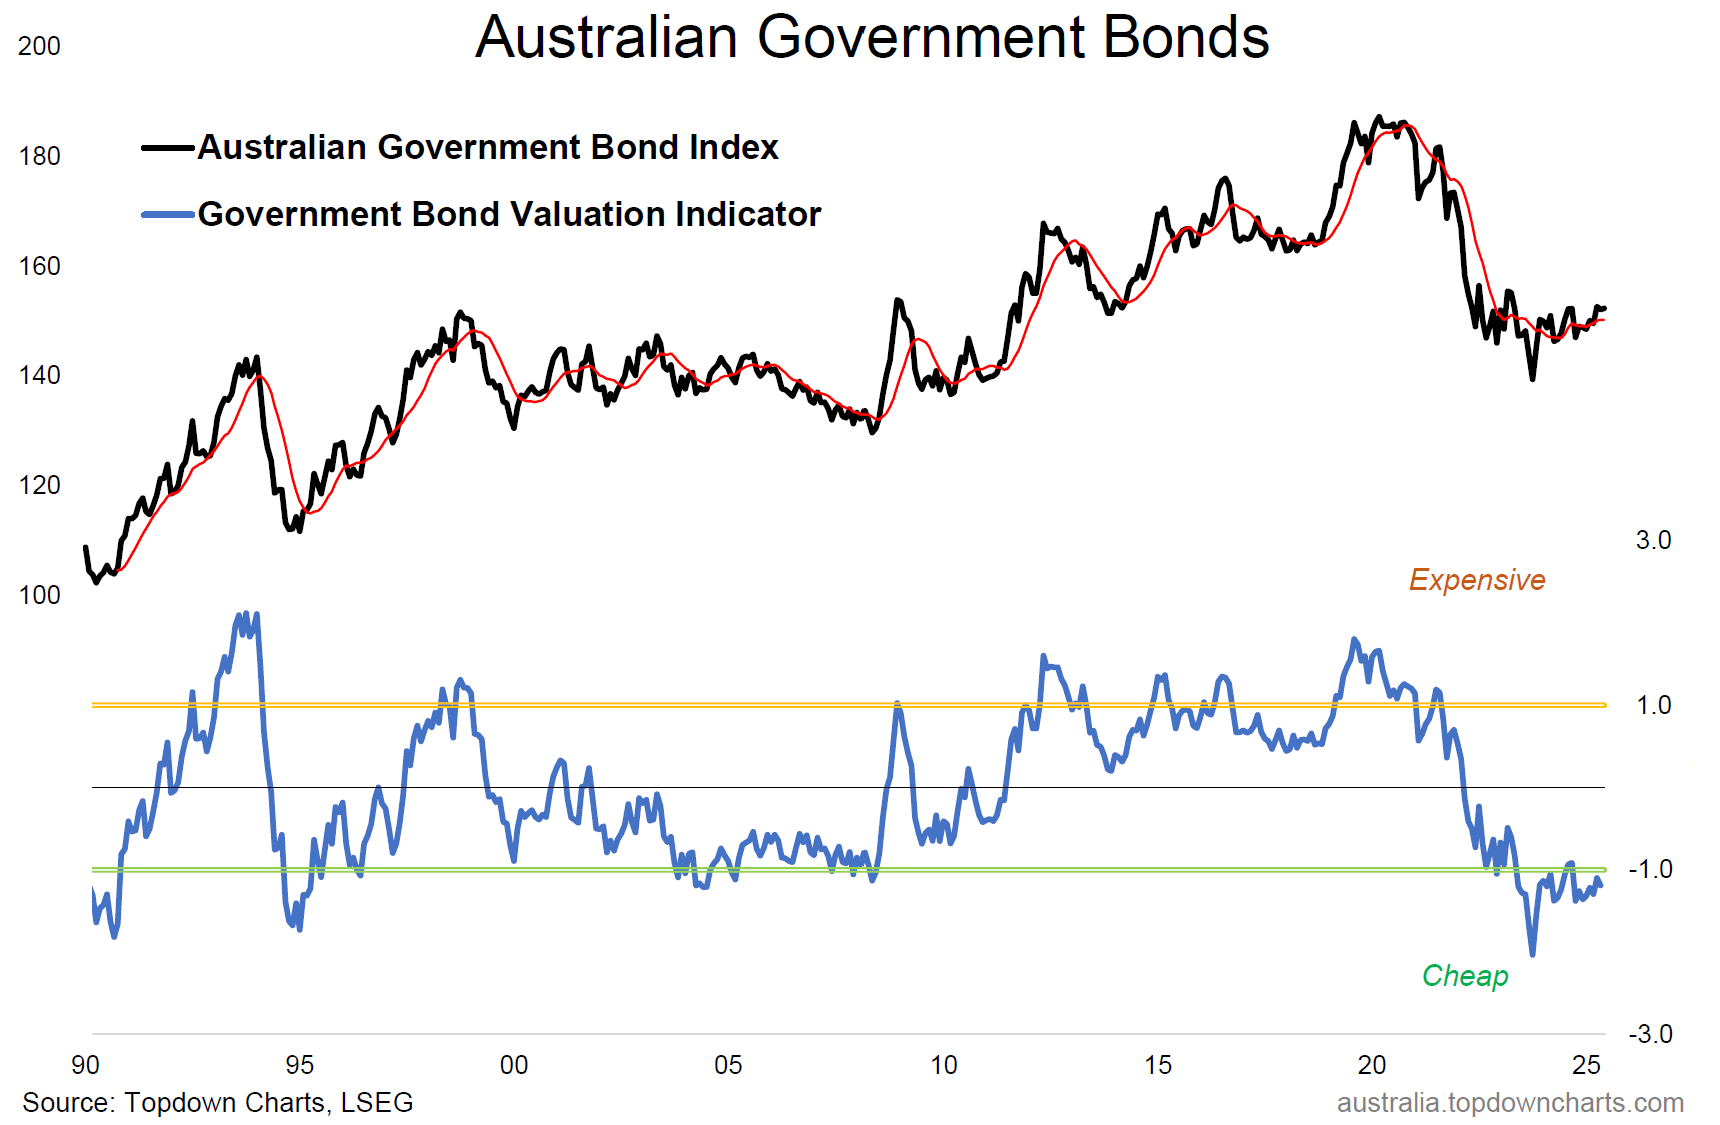
The chart shows the 7-10yr ACGB index in the black line (i.e. the price), with its 10-month moving average. The reason we look at 10-month moving averages (which is approximately 200 trading days) is that the 10-month/200-day moving average gives a best guess proxy/heuristic for trend.
When the price is above the 10-month average, it indicates an uptrend (and when the 10-month moving average is upward sloping that’s another indicator of an uptrend).
It’s worth keeping these basic technical heuristics in mind because they are highly complementary when used alongside valuation indicators.
Valuation indicators (when designed well) are supposed to tell you when the market is expensive (at risk of falling or at least topping out) or cheap (greater chance of upside opportunity). But one of the biggest pitfalls in using valuation indicators is timing, this is why all of our valuation charts show this basic technical data alongside the valuation indicators.
With that established, let’s see what’s going on with ACGBs.
Price is undergoing classic bottoming behavior: it reached a capitulation low, turned up, and has made a series of minor higher highs and higher lows + price is above its (upward sloping) 10-month moving average. So from a technicals standpoint it looks promising; we just ideally need to see it break out of that range.
As for the valuation side of things, it’s still showing up as extreme cheap. So you have promising technicals + cheap valuations, which is generally a winning combination.
The main risk from here would be that it gets cheaper or stays cheap —i.e. that the initial improvement in the technicals fails, but we should be able to detect that by monitoring the price side of things.
Other than that it’s about keeping tabs on the macro pulse, in terms of catalysts e.g. a string of RBA rate cuts (and/or weaker growth and inflation) would be helpful (and the RBA has indeed already pivoted to easing).
But a final thought is, while the outlook I would say is kind of binary (we either get recession or resurgence), from an asset allocation standpoint it’s particularly interesting to see diversifiers/downside protectors like bonds trading at cheap valuations. In other words, it’s much cheaper than usual to have downside protection from bonds than usual (and bonds will perform well in a non-inflationary downturn).
So a few things to ponder on and keep track of here.
Key point: Australian Government Bonds are cheap and bottoming.
n.b. the Australian Government Bond Index shown in the chart is the ICE BofA 7-10 Year Australia Government Index (price only), the red line is its 10-month moving average, and the blue line is our proprietary valuation indicator for Australian Government Bonds (focused on the 10-year), and the chart is from our Aussie monthly pack.
This note was brought to you by the Australian Market Valuation Book
About the Australian Market Valuation Book
The Australian Market Valuation Book features exclusive, innovative, and insightful indicators to provide Clarity and Decision support to Australian investors +those who allocate-to or are interested in understanding this market.
Specifically, the pack covers:
Australian Equities (ASX 200, Small Ords, Banks, Resources, sectors, AREITs).
Australian Fixed Income (corporate credit, government bonds, rates)
Other key markets (AUDUSD, A$ Gold, housing)
Capital Market Assumptions (expected returns for the major assets)
The pack focuses on delivering insight into:
Valuations: is the market cheap/expensive (or neutral)
Trend: is the market in an up/down trend
Price: updates and visibility on where things are tracking
Relative value: comparing absolute and relative prospects
Overall it’s an easy way of quickly and efficiently understanding where the big risks and opportunities are in Australian markets.
Act Now — activate a 7-day trial pass to get instant access to the latest chartbook (+archives) and see if it’s right for you:
Best wishes,
Callum Thomas
Head of Research & Founder
Topdown Charts | www.topdowncharts.com
LinkedIn: https://www.linkedin.com/in/callum-thomas-4990063/
NEW: Other services by Topdown Charts
Topdown Charts Entry-Level — [TD entry-level service]
Topdown Charts Professional — [institutional service]
Weekly S&P 500 ChartStorm —[US Equities in focus]
Monthly Gold Market Pack — [Gold charts]
Australian Market Valuation Book —[Aussie markets]