
Chart: Australian Stock/Bond Ratio
An Aussie anomaly presenting potential angst for asset allocators..

The stock/bond ratio is something investors the world over pay attention to because it both represents the most important relative performance line for asset allocators and gives clues on the path of the two main public market asset classes.
The Australian stock/bond ratio stands out for a few reasons.
Technicals: while there is a fairly clear and strong uptrend in progress the Australian stock/bond ratio is looking very stretched vs trend (we’ve seen this indicator peak in the past when it surged to similar extremes).
Valuations: the latest monthly pack shows Australian stocks slightly expensive, and Australian government bonds very cheap. So from a relative value standpoint bonds have the advantage.
Macro: that said, as discussed in a recent note on the US Stock/Bond Ratio, for the stock/bond ratio to really turn down you typically need to see stocks falling, and most of the time that’s when recession is on the horizon (no clear signs as yet).
So while the Aussie stock/bond ratio could have further to run, it will pay for Australian investors to be vigilant as relative risks rise.
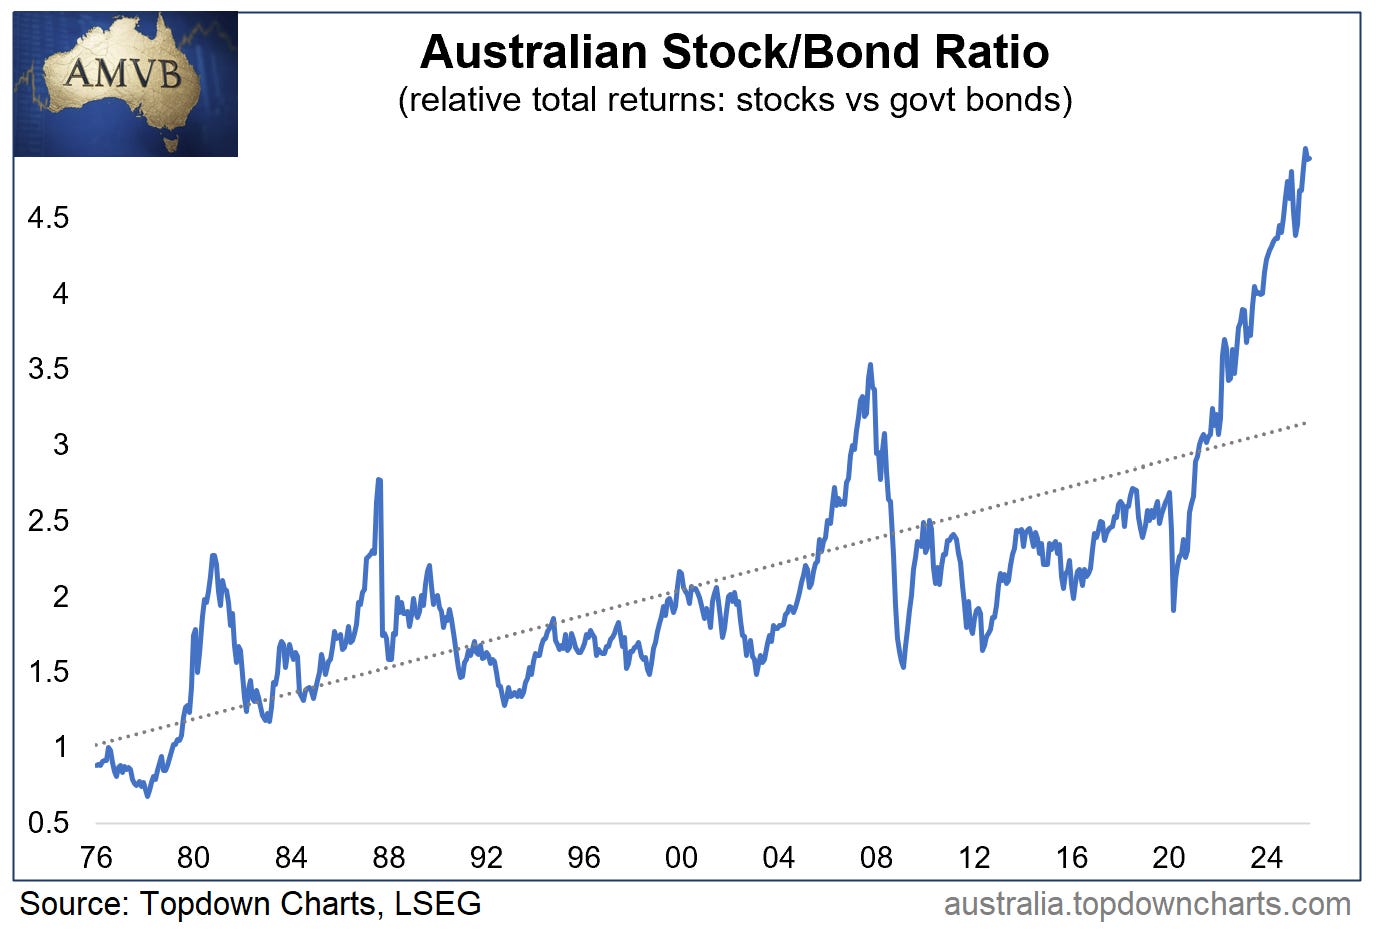
Key takeaway: The Australian stock/bond ratio is at historical extremes, and warrants monitoring as relative value moves in favor of bonds.
ALERT: 2026 Big Ideas Outlook Webinar
In this webinar Head of Research & Founder of Topdown Charts, Callum Thomas will take you through some of his big charts and big ideas for the global macro-market outlook that are either already in progress or set to become major risks/opportunities into 2026 — [ Register Now ]
[Webinar is scheduled for EST 2pm Wednesday the 12th of November 2025]
About the Australian Market Valuation Book
The Australian Market Valuation Book features exclusive, innovative, and insightful indicators to provide Clarity and Decision support to Australian investors +those who allocate-to or are interested in understanding this market.
Specifically, the pack covers:
Australian Equities (ASX 200, Small Ords, Banks, Resources, sectors, AREITs).
Australian Fixed Income (corporate credit, government bonds, rates)
Other key markets (AUDUSD, A$ Gold, housing)
Capital Market Assumptions (expected returns for the major assets)
The pack focuses on delivering insight into:
Valuations: is the market cheap/expensive (or neutral)
Trend: is the market in an up/down trend
Price: updates and visibility on where things are tracking
Relative value: comparing absolute and relative prospects
Overall it’s an easy way of quickly and efficiently understanding where the big risks and opportunities are in Australian markets.
Act Now — activate a 7-day trial pass to get instant access to the latest chartbook (+archives) and see if it’s right for you:
Best wishes,
Callum Thomas
Head of Research & Founder
Topdown Charts | www.topdowncharts.com
LinkedIn: https://www.linkedin.com/in/callum-thomas-4990063/
NEW: Other services by Topdown Charts
Topdown Charts Entry-Level — [TD entry-level service]
Topdown Charts Professional — [institutional service]
Weekly S&P 500 ChartStorm —[US Equities in focus]
Monthly Gold Market Pack — [Gold charts]
Australian Market Valuation Book —[Aussie markets]
n.b. apologies, the original note had a link error, "the latest monthly pack" should point to the latest pack here: https://australia.topdowncharts.com/p/australian-market-valuation-book-f68