
Chart: Housing Market Valuations
Australia & New Zealand have this one controversial thing in common...

Australian and New Zealand share many things in common, but one key issue they both share + struggle with — and let’s be honest: also revel in, is evermore expensive housing markets. It’s a source and store of wealth for many but a hardship and sore point for others. And this week’s chart lays it out clear and bare.
Despite an initial correction following the 2020 stimulus surge in housing, the OECD valuation indicators (price-to-rent and price-to-income ratios) are still at levels never before seen prior to the pandemic (even higher than before the 08 housing bust).
But the other standout is that house prices have been trending up and getting structurally more expensive over the years. This reflects: the structural decline in interest rates, the dual-income trap, rising populations (and immigration) on the demand side, and constraints on supply growth.
As with other markets, the old saying that “valuations don’t matter until they matter“ echo on here too, and ultimately while this represents a key social/political issue + economic and financial system fragility, housing markets only really go down big time when you get either or a combination of surging interest rates, excessive leverage, rising unemployment, macro-prudential tightening, surge in supply, slowdown in population growth, etc.
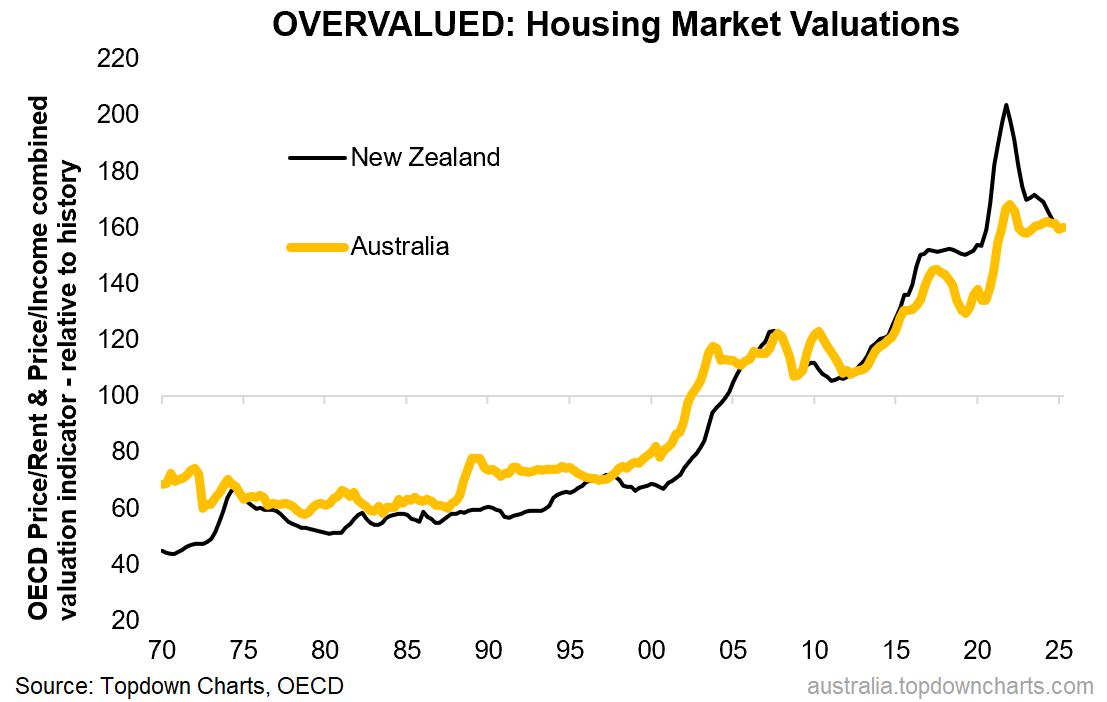
Key takeaway: Despite an initial correction, Australia and New Zealand still see historically expensive housing markets (a key macro risk and political issue).
This note was brought to you by the Australian Market Valuation Book
About the Australian Market Valuation Book
The Australian Market Valuation Book features exclusive, innovative, and insightful indicators to provide Clarity and Decision support to Australian investors +those who allocate-to or are interested in understanding this market.
Specifically, the pack covers:
Australian Equities (ASX 200, Small Ords, Banks, Resources, sectors, AREITs).
Australian Fixed Income (corporate credit, government bonds, rates)
Other key markets (AUDUSD, A$ Gold, housing)
Capital Market Assumptions (expected returns for the major assets)
The pack focuses on delivering insight into:
Valuations: is the market cheap/expensive (or neutral)
Trend: is the market in an up/down trend
Price: updates and visibility on where things are tracking
Relative value: comparing absolute and relative prospects
Overall it’s an easy way of quickly and efficiently understanding where the big risks and opportunities are in Australian markets.
Act Now — activate a 7-day trial pass to get instant access to the latest chartbook (+archives) and see if it’s right for you:
Best wishes,
Callum Thomas
Head of Research & Founder
Topdown Charts | www.topdowncharts.com
LinkedIn: https://www.linkedin.com/in/callum-thomas-4990063/
NEW: Other services by Topdown Charts
Topdown Charts Entry-Level — [TD entry-level service]
Topdown Charts Professional — [institutional service]
Weekly S&P 500 ChartStorm —[US Equities in focus]
Monthly Gold Market Pack — [Gold charts]
Australian Market Valuation Book —[Aussie markets]