
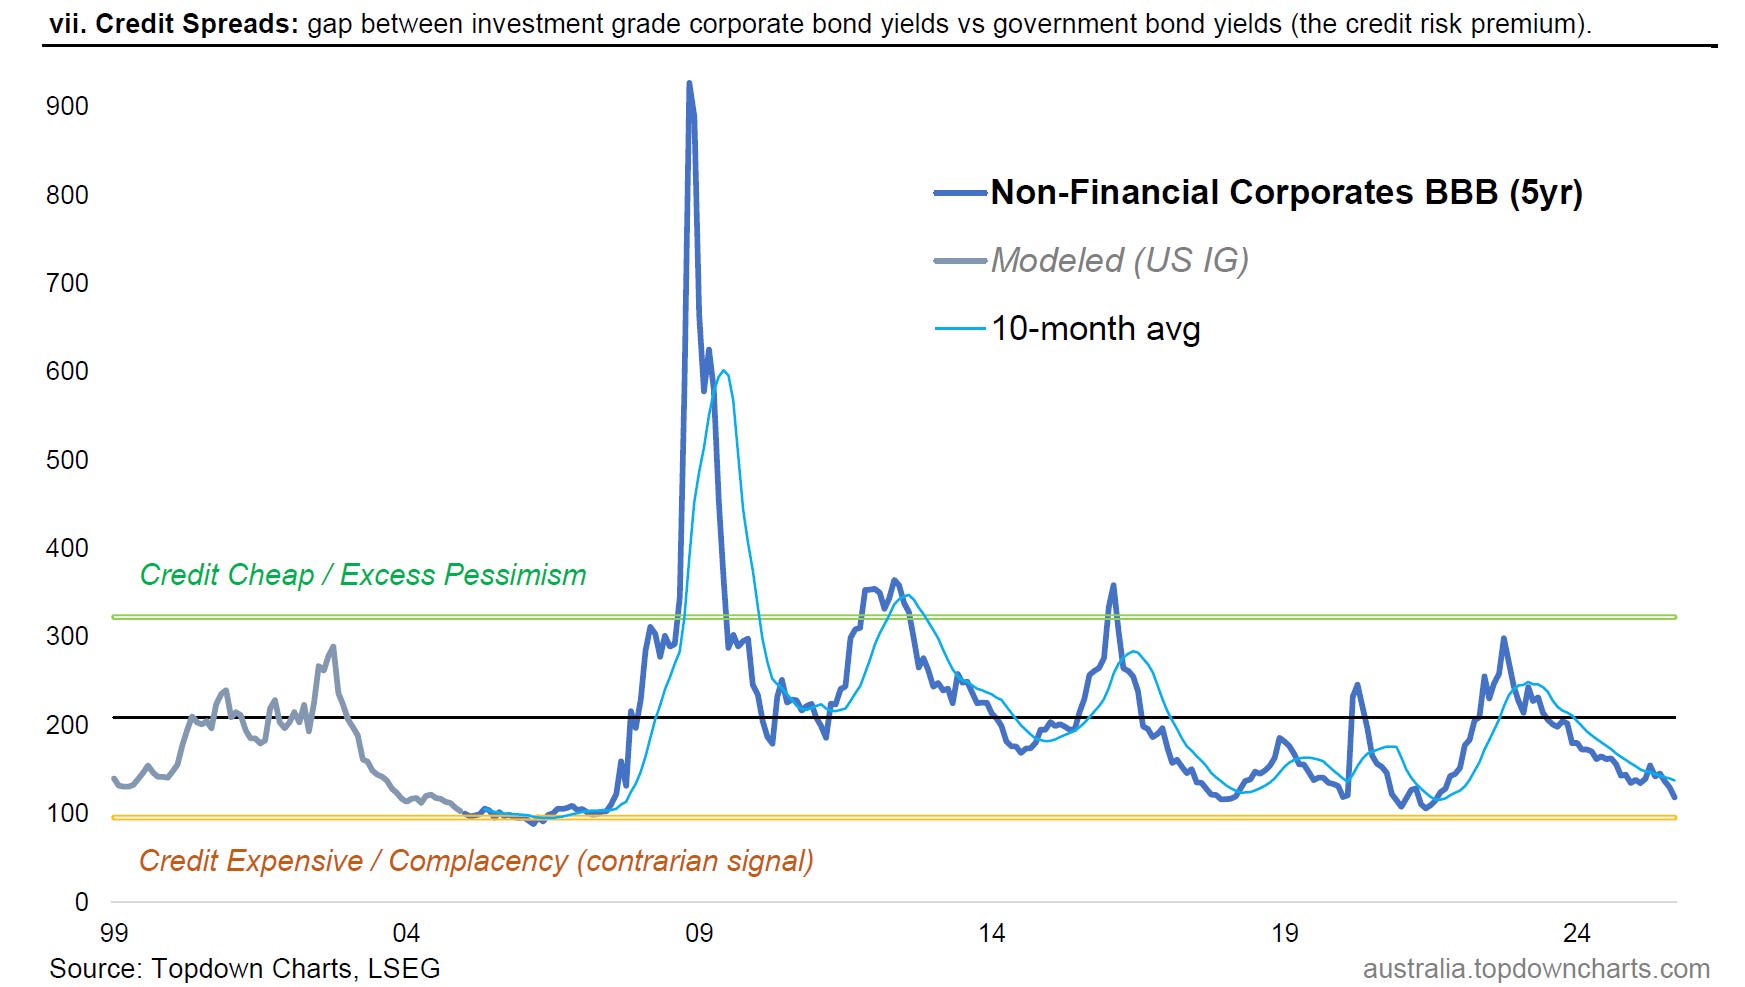
Chart: Australian Credit Spreads
Credit markets are showing signs of complacency, but there's a few important points to note...

Australian corporate credit spreads are approaching historical lows, which means investors are receiving much less compensation than usual for taking on credit risk. There’s a few important implications and caveats arising from this.
The first point is when it comes to credit markets, spreads are like the upside-down equivalent of PE ratios in equity markets (see explainer below). So when you reach very low levels of spreads (like now) that basically means credit is expensive and we’re progressing through the later stages of the market cycle.
The other thing that I’d point out is that this is exactly what’s also going on around the rest of the world, for instance US credit spreads are hovering around levels we last saw just prior to the financial crisis in 2007. This can signal confidence (when it is well justified; during the early-mid stage of the market cycle), but also complacency (during the later stages of the market cycle).
The final point to note would be that even while this indicator does tell us things about the state of the market cycle, investors can still make money in credit when spreads are low if the running yield is decent or if you get a rally in duration during an economic soft patch (that’s not offset by a wave of defaults or spikes in spreads). There’s also the point that spreads can stay low and calm for prolonged periods e.g. during the mid-2000’s. So you have to be pragmatic about things.
Key takeaway: Australian credit spreads are at expensive levels (much like rest of world), investors need to understand what this means from a risk perspective; but also remain pragmatic.
This note was brought to you by the Australian Market Valuation Book
Credit Spread Cycles: just as the stockmarket goes through cycles (reflecting cycles in economic activity, monetary/financial cycles, and industrialization/innovation/investment cycles), credit spreads also go through cycles, as summarized in the chart below.
Click through for a more detailed explanation [Here].

About the Australian Market Valuation Book
The Australian Market Valuation Book features exclusive, innovative, and insightful indicators to provide Clarity and Decision support to Australian investors +those who allocate-to or are interested in understanding this market.
Specifically, the pack covers:
Australian Equities (ASX 200, Small Ords, Banks, Resources, sectors, AREITs).
Australian Fixed Income (corporate credit, government bonds, rates)
Other key markets (AUDUSD, A$ Gold, housing)
Capital Market Assumptions (expected returns for the major assets)
The pack focuses on delivering insight into:
Valuations: is the market cheap/expensive (or neutral)
Trend: is the market in an up/down trend
Price: updates and visibility on where things are tracking
Relative value: comparing absolute and relative prospects
Overall it’s an easy way of quickly and efficiently understanding where the big risks and opportunities are in Australian markets.
Act Now — activate a 7-day trial pass to get instant access to the latest chartbook (+archives) and see if it’s right for you:
Best wishes,
Callum Thomas
Head of Research & Founder
Topdown Charts | www.topdowncharts.com
LinkedIn: https://www.linkedin.com/in/callum-thomas-4990063/
NEW: Other services by Topdown Charts
Topdown Charts Entry-Level — [TD entry-level service]
Topdown Charts Professional — [institutional service]
Weekly S&P 500 ChartStorm —[US Equities in focus]
Monthly Gold Market Pack — [Gold charts]
Australian Market Valuation Book —[Aussie markets]